Oracle Business Intelligence Implementation Scenario

- What are my future payments due to banks?
- What is the status of in-transit shipments?
- What is the import volume of each category?
- What is the comparative imports volume?
- What is the import volume of individual products?
- What is the business volume with different suppliers?
- How to avoid demurrage and government penalties?
- How to evaluate the performance of fianance department?
- How to create and schedule reports and deliver them automatically to multiple delivery destinations?
In reply to the above queries, the IT department suggested a dashboard that would display all the information on a single screen.
ABC Corporation is using Oracle 11g database on the backend. So, the development team has decided to take advantage of the most robust tool, Oracle Business Intelligence, to prepare a professional looking dashboard for Mr. Frank. The team initiates the project by conducting an analysis on the existing application and corresponding database objects.
After analysis, the project team decided to use the following OBIEE components:
Analyses:
You query your organization's data through analysis. It is the main tool to answer your business questions. It provides you the ability to visually present data in tables, pivot tables, graphs and so on. You can add calculated items and enjoy the drill down functionality that enables you to browse detail information.
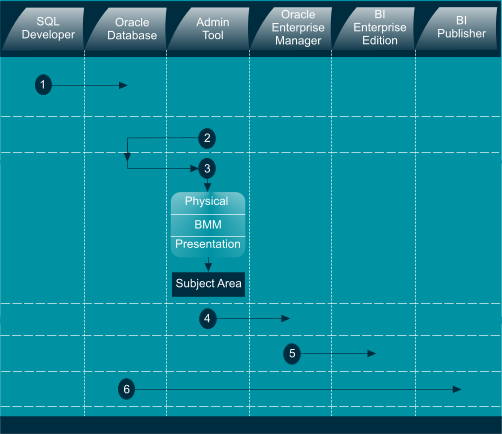
After creating analyses, you integrate them into Oracle BI dashboard. An embedded analysis executes automatically and displays the most current results every time the dashboard is accessed. Once processed, an analysis sends the request in the form of logical SQL statements to the Oracle BI Server. The Oracle BI Server contacts relevant data sources through its generated queries and fetches the results in a format not suitable for the end user. It performs calculations and filtration tasks on the fetched results and sends the data to Oracle BI Presentation Services to format the results in a way that is understandable and meaningful to the recipient.
After creating analyses, you integrate them into Oracle BI dashboard. An embedded analysis executes automatically and displays the most current results every time the dashboard is accessed. Once processed, an analysis sends the request in the form of logical SQL statements to the Oracle BI Server. The Oracle BI Server contacts relevant data sources through its generated queries and fetches the results in a format not suitable for the end user. It performs calculations and filtration tasks on the fetched results and sends the data to Oracle BI Presentation Services to format the results in a way that is understandable and meaningful to the recipient.
Views:
After setting the analysis criteria, when you click the Results tab, you view the output in a generic table comprising rows and columns. You can further enhance the presentation capabilities of analyses by adding a variety of views including pivot tables, graphs,tickers and so on. Some of these allow you to drill down to more detailed information (you can drill in attribute columns and hierarchical columns).
Agents:
Agent is a very useful component in Oracle BI that automates business processes by providing event-driven alerting, scheduled content publishing, and conditional event-driven action execution. It dynamically detects information-based problems and opportunities, determines the concerned users to alert, and delivers information to them through a wide range of devices including email, phones, and more. You can perform the following tasks with an agent:
- Select analysis that is to be distributed
- Choose automatically executing Actions depending on a condition
- Create schedule to run an Agent
- Set a condition that evaluates what the Agent is going to perform
Alerts:
An alert is a notification generated by an agent that is usually displayed on the main dashboard page. An agent automatically performs a specified catalog analysis on a defined schedule, and evaluates a specific problem or opportunity in the results. It triggers an alert upon detecting a specific problem or opportunity and delivers personalized and actionable content to specified recipients and to agent subscribers using the delivery options that are specified for each person.
Key Performance Indicators (KPIs):
Larger organizational strategies are evolved through its business goals and objectives. In order to evaluate, monitor, and improve these strategies, special measurements such as KPIs are created. Key performance indicators are the detailed specifications used to track business objectives.
KPIs are created based on business objectives. A business objective is an executive statement of direction in support of a corporate strategy. The business objective is a high-level goal that is quantifiable, measurable, and results-oriented. The business objective is translated into a KPI that enables the organization to measure some aspect of the process against a target that they define.
A KPI is associated with a specific process and is generally represented by a numeric value. A KPI may have a target and allowable margins, or lower and upper limits, forming a range of performance that the process should achieve. A KPI can be thought of as a metric with a target.
A simple KPI example would be: As per historical records, average period taken to clear a shipment is four days. To reduce this period an organization sets the following business objectives:
- Shipments must be cleared within three days compared to the current average of four days
- Average duties payment period, to be taken by its finance department, should be two days
The business analyst of the company sets and monitors the following KPIs to evaluate if these two new processes are helping the organization to achieve its business objectives:
Shipment Clearance KPI: Track the shipment arrival date against the clearance date and monitor the average clearance time which should be within the range of three days target.
Duties Payment KPI: Track the average time taken by the finance department to hand over the duties pay order to the clearing agent. This interval is measured by evaluating the difference between shipment arrival date and duties payment date.
Each KPI can have an associated target with margins, or lower and upper limits. The limits and margins indicate a range that the KPI should remain within.
Following are some of the specific uses of KPIs in Oracle BI:
- Evaluate metrics against their targets and alert the appropriate users via agents when targets are not met.
- You can create an analysis from a KPI and add it to a dashboard. Such analyses will allow you to drill into different levels of details based on the KPI’s dimensions. For example, to a KPI called Product Imports, you can add the Country and Fiscal dimensions to view Product Imports figures by country and time periods such as year and month. This enables you to gather multi-dimensional subsets of data and evaluate the performance of objectives and initiatives that the KPI measures against the different target values of the dimensional metrics.
- You can also use KPIs in Oracle Scorecard and Strategy Management to evaluate and monitor the performance of the objectives that form the strategy and the initiatives that are needed to meet the organization's objectives. For example, use KPIs for "Average Customer Satisfaction Survey Score" and "Repeat Orders" to measure the performance of an "Improved Customer Satisfaction" objective.
You can determine a KPI's status by comparing its actual value against the defined thresholds. For visual presentation, you assign status icons to each range that represents the performance status of KPI. For example, to monitor shipment clearance duration, in which low values are desirable, you can define the ranges that are described in the following table.

Scorecard and Strategy Management:
Oracle Scorecard and Strategy Management is a performance management tool that lets you describe and communicate your business strategy. You can drive and assess your corporate strategy and performance at all levels of your organization. You use this tool to define objectives and initiatives such as "Decrease Operational Cost" and "Establish Cost Minimization Team" respectively. You then assign KPIs to measure progress and performance. Besides setting targeted numeric ranges to evaluate the values of KPIs, you are able to graphically communicate your organization's strategy using strategy maps, cause & effect maps, custom views, and strategy trees. You can also discuss the implementation and status of objectives and initiatives by adding, reading, and replying to comments. Because you use KPIs in scorecards to measure progress and performance over time, best practice is to include appropriate time dimensions when defining KPIs to be used within scorecards.Oracle BI Publisher:
A strategic enterprise reporting product that provides the ability to create and manage highly formatted reports from a wide range of data sources. Oracle BI Publisher is available as part of the Oracle BI Enterprise Edition Suite and also as a standalone reporting tool. Oracle BI Publisher report formats can be designed using Microsoft Word or Adobe Acrobat, the tools that are easy to use, and most users are already familiar with. Oracle BI Publisher also allows you to create reports from different types of data sources such as Oracle Database, Files, BI EE, Web services, and Discoverer.The latest release of Oracle BI Publisher has enhanced, easy- to-use user interface (UI), many enhanced features, and newly introduced salient features such as - Data Model Editor - a graphical user interface for building data models within the BI Publisher interface; and Layout Editor - a design tool that enables you to create report layouts within the BI Publisher interface. BI Publisher also enables you to schedule reports and deliver the reports to multiple delivery destinations required by your business. Following is the list of tasks that you can perform with BI Publisher:
- Run and view reports from the BI Publisher reports repository
- Schedule reports to run at selected intervals and to be delivered via any channel set up by your administrator
- Create an ad hoc analysis of report data using BI Publisher's Analyzer feature
- Open and manipulate reports in Microsoft Excel using BI Publisher's Analyzer for Microsoft Excel