Saturday 1 December 2012

How to use Dashboards in Business Intelligence Applications

What a dashboard is?

Dashboard is the most important component in business intelligence. A dashboard can have one or more pages that are identified by unique titles on top of each page. The basic function of a dashboard is to display personalized views of information extracted from different data sources. By personalized I mean different views for different set of users.Dashboard pages display this information in a web browser using BI components such as analyses results, action links and menus, alerts, BI Publisher reports and more.

This section of the book, Implement Oracle Business Intelligence, creates the main page of Imports Management Information dashboard. As shown in the figure below, it presents five different graphical views to answers the first five questions asked by Mr. Frank - the Imports department head. This is the first page that he browses after successfully logging in to his dashboard.

In addition to providing information in graphical format on the main page, you are also guided on how to create a separate dashboard page named Data to display actual data behind these graphs in the form of tables for each question.  


A. Future Payments: This information will be presented using the ticker view that displays the results as a ticker or marquee, similar in style to the stock tickers that run across many financial and news sites on the Internet.

B. Shipment Tracking: This section holds information about the in-transit shipments to keep their track.

C. Product Category Volume: Provides the import volume information about the three categories the company deals in.

D. Import Volume: Shows annual comparative imports volume.

E. Product Volume – Current vs. Last Year: The Category Volume section displays cumulative information for each category. This section contains volume information for each individual product.

F. Detail Links: Text links are created using the Action Link Object. You can see one each in the four sections above. Clicking these links will allow the user to get to the details (data table) of the presented graphical information.

Tuesday 27 November 2012

Business Intelligence Case Study

Oracle Business Intelligence Implementation Scenario


This post presents the case study followed in the book "Implement Oracle Business Intelligence". The Import department of  ABC Corporation is using an Imports Management and Information Software, The Import Manager, to manage its imports proceedings. The software produces several key reports to provide insight into the imports process, but individually. The Imports department head, Mr. Frank, wants to see all the information at a glance. In addition, he needs some specific reports and vigilant information that the existing software cannot deliver proactively. He discussed the problem with the IT head and put-up the following questions:

  • What are my future payments due to banks?
  • What is the status of in-transit shipments?
  • What is the import volume of each category?
  • What is the comparative imports volume?
  • What is the import volume of individual products?
  • What is the business volume with different suppliers?
  • How to avoid demurrage and government penalties?
  • How to evaluate the performance of fianance department?
  • How to create and schedule reports and deliver them automatically to multiple delivery destinations?
In reply to the above queries, the IT department suggested a dashboard that would display all the information on a single screen. 

ABC Corporation is using Oracle 11g database on the backend. So, the development team has decided to take advantage of the most robust tool, Oracle Business Intelligence, to prepare a professional looking dashboard for Mr. Frank. The team initiates the project by conducting an analysis on the existing application and corresponding database objects.

After analysis, the project team decided to use the following OBIEE components:


Analyses: 

You query your organization's data through analysis. It is the main tool to answer your business questions. It provides you the ability to visually present data in tables, pivot tables, graphs and so on. You can add calculated items and enjoy the drill down functionality that enables you to browse detail information.

After creating analyses, you integrate them into Oracle BI dashboard. An embedded analysis executes automatically and displays the most current results every time the dashboard is accessed. Once processed, an analysis sends the request in the form of logical SQL statements to the Oracle BI Server. The Oracle BI Server contacts relevant data sources through its generated queries and fetches the results in a format not suitable for the end user. It performs calculations and filtration tasks on the fetched results and sends the data to Oracle BI Presentation Services to format the results in a way that is understandable and meaningful to the recipient. 

Views: 

After setting the analysis criteria, when you click the Results tab, you view the output in a generic table comprising rows and columns. You can further enhance the presentation capabilities of analyses by adding a variety of views including pivot tables, graphs,tickers and so on. Some of these allow you to drill down to more detailed information (you can drill in attribute columns and hierarchical columns).


Agents: 

Agent is a very useful component in Oracle BI that automates business processes by providing event-driven alerting, scheduled content publishing, and conditional event-driven action execution. It dynamically detects information-based problems and opportunities, determines the concerned users to alert, and delivers information to them through a wide range of devices including email, phones, and more. You can perform the following tasks with an agent:
  • Select analysis that is to be distributed
  • Choose automatically executing Actions depending on a condition
  • Create schedule to run an Agent   
  • Set a condition that evaluates what the Agent is going to perform


Alerts: 

An alert is a notification generated by an agent that is usually displayed on the main dashboard page. An agent automatically performs a specified catalog analysis on a defined schedule, and evaluates a specific problem or opportunity in the results. It triggers an alert upon detecting a specific problem or opportunity and delivers personalized and actionable content to specified recipients and to agent subscribers using the delivery options that are specified for each person.


Key Performance Indicators (KPIs): 

Larger organizational strategies are evolved through its business goals and objectives. In order to evaluate, monitor, and improve these strategies, special measurements such as KPIs are created. Key performance indicators are the detailed specifications used to track business objectives.

KPIs are created based on business objectives. A business objective is an executive statement of direction in support of a corporate strategy. The business objective is a high-level goal that is quantifiable, measurable, and results-oriented. The business objective is translated into a KPI that enables the organization to measure some aspect of the process against a target that they define.

A KPI is associated with a specific process and is generally represented by a numeric value. A KPI may have a target and allowable margins, or lower and upper limits, forming a range of performance that the process should achieve. A KPI can be thought of as a metric with a target.

A simple KPI example would be: As per historical records, average period taken to clear a shipment is four days. To reduce this period an organization sets the following business objectives:
  • Shipments must be cleared within three days compared to the current average of four days
  • Average duties payment period, to be taken by its finance department, should be two days

The business analyst of the company sets and monitors the following KPIs to evaluate if these two new processes are helping the organization to achieve its business objectives:

Shipment Clearance KPI: Track the shipment arrival date against the clearance date and monitor the average clearance time which should be within the range of three days target.

Duties Payment KPI: Track the average time taken by the finance department to hand over the duties pay order to the clearing agent. This interval is measured by evaluating the difference between shipment arrival date and duties payment date.

Each KPI can have an associated target with margins, or lower and upper limits. The limits and margins indicate a range that the KPI should remain within.

Following are some of the specific uses of KPIs in Oracle BI:
  • Evaluate metrics against their targets and alert the appropriate users via agents when targets are not met.
  • You can create an analysis from a KPI and add it to a dashboard. Such analyses will allow you to drill into different levels of details based on the KPI’s dimensions. For example, to a KPI called Product Imports, you can add the Country and Fiscal dimensions to view Product Imports figures by country and time periods such as year and month. This enables you to gather multi-dimensional subsets of data and evaluate the performance of objectives and initiatives that the KPI measures against the different target values of the dimensional metrics.
  • You can also use KPIs in Oracle Scorecard and Strategy Management to evaluate and monitor the performance of the objectives that form the strategy and the initiatives that are needed to meet the organization's objectives. For example, use KPIs for "Average Customer Satisfaction Survey Score" and "Repeat Orders" to measure the performance of an "Improved Customer Satisfaction" objective.

You can determine a KPI's status by comparing its actual value against the defined thresholds. For visual presentation, you assign status icons to each range that represents the performance status of KPI. For example, to monitor shipment clearance duration, in which low values are desirable, you can define the ranges that are described in the following table.


 Scorecard and Strategy Management: 

Oracle Scorecard and Strategy Management is a performance management tool that lets you describe and communicate your business strategy. You can drive and assess your corporate strategy and performance at all levels of your organization. You use this tool to define objectives and initiatives such as "Decrease Operational Cost" and "Establish Cost Minimization Team" respectively. You then assign KPIs to measure progress and performance. Besides setting targeted numeric ranges to evaluate the values of KPIs, you are able to graphically communicate your organization's strategy using strategy maps, cause & effect maps, custom views, and strategy trees. You can also discuss the implementation and status of objectives and initiatives by adding, reading, and replying to comments. Because you use KPIs in scorecards to measure progress and performance over time, best practice is to include appropriate time dimensions when defining KPIs to be used within scorecards.

Oracle BI Publisher: 

A strategic enterprise reporting product that provides the ability to create and manage highly formatted reports from a wide range of data sources. Oracle BI Publisher is available as part of the Oracle BI Enterprise Edition Suite and also as a standalone reporting tool. Oracle BI Publisher report formats can be designed using Microsoft Word or Adobe Acrobat, the tools that are easy to use, and most users are already familiar with. Oracle BI Publisher also allows you to create reports from different types of data sources such as Oracle Database, Files, BI EE, Web services, and Discoverer.

The latest release of Oracle BI Publisher has enhanced, easy- to-use user interface (UI), many enhanced features, and newly introduced salient features such as - Data Model Editor - a graphical user interface for building data models within the BI Publisher interface; and Layout Editor - a design tool that enables you to create report layouts within the BI Publisher interface. BI Publisher also enables you to schedule reports and deliver the reports to multiple delivery destinations required by your business. Following is the list of tasks that you can perform with BI Publisher:
  • Run and view reports from the BI Publisher reports repository
  • Schedule reports to run at selected intervals and to be delivered via any channel set up by your administrator
  • Create an ad hoc analysis of report data using BI Publisher's Analyzer feature
  • Open and manipulate reports in Microsoft Excel using BI Publisher's Analyzer for Microsoft Excel

Monday 26 November 2012

Application Development Process in Oracle Business Intelligence Enterprise Edition

Oracle Business Intelligence Enterprise Edition Process Flow

This blog post briefs how applications are developed in Oracle Business Intelligence Enterprise Edition.


Oracle Business Intelligence Enterprise Edition (OBIEE) is one of the best business intelligence solution available on the market today. From simple analyses to professional dashboard creation and from scheduled reporting to proactive alerts, OBIEE offers all the required components that help organizations assess their business proceedings proactively and in real time.

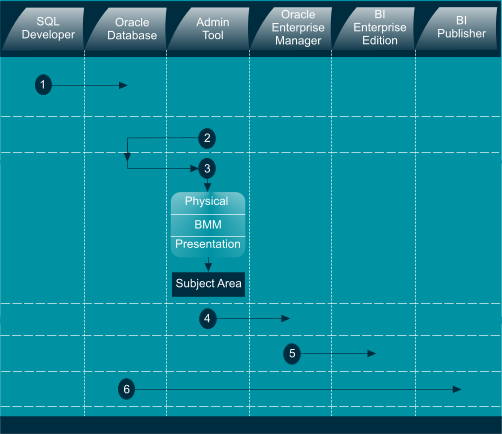
The following illustration depicts OBIEE application development process:


Step 1: You need a SQL client tool such as SQL Developer to create database objects. In the book, Implement Oracle Business Intelligence, we used this tool to create sample tables needed for demo exercises.

Step 2: In this step we connect BI Administration tool to Oracle database. The Administration Tool is a Windows client application that is used to create and modify Oracle BI repository.

Step 3: Here, we create the three layers (Physical, Business Model and Mapping, and Presentation). The Physical layer defines the objects and relationships that is needed by OBIEE server to write native queries against the physical data source. The BMM layer is created to determine the analytic behavior. The Presentation layer carries one or more Subject Areas that presents personalized and secure views of business model to users according to their roles.

Step 4: After creating the desired Subject Areas in the Presentation layer, the repository is saved and uploaded to the BI Server through Oracle Enterprise Manager interface (http://localhost:7001/em). The repository must be uploaded after modification to reflect the changes.

Step 5: Once a repository is uploaded, you can connect to BI Enterprise Edition interface using url http://localhost:9704/analytics. You can use many OBIEE components such as analyses, dashboards, agents, graphs, tables etc. to present data either in generic tables or in graphical formats.

Step 6: In this step you create professional looking reports in Oracle BI Publisher after connecting the data source (in our scenario Oracle Database). Oracle BI Publisher, now available as part of Oracle BI, is a strategic enterprise reporting product to create and manage highly formatted reports from a wide range of data sources including JDBC (Oracle & other databases), BIEE, XML Files, OLAP, JNDI, Fusion Application, HTTP, Web Services, and Discoverer.

BI Publisher has a salient feature called Data Model Editor, a graphical user interface, which enables you to build data models for your reports. It also provides a web-based design tool named Layout Editor to create report layouts within the BI Publisher interface. After creating reports, you have the option to schedule these reports and deliver them to multiple delivery destinations.


Saturday 3 November 2012

Oracle Business Intelligence Enterprise Edition Book

Table of Content


Chapter 1 - Oracle Business Intelligence - Introduction

1.1 Data and Information
1.2 SQL and its Limitation
1.3 What is Business Intelligence?
1.4 Why Use Business Intelligence?
1.5 What are the Benefits?
1.6 Oracle Business Intelligence
1.7 Oracle BI Repository and BI Server
1.8 Measures, Dimensions and  BI Repository Layers
        1.8.1 Logical Fact Tables
        1.8.2 Logical Dimension Tables
        1.8.3 Identifying Dimensions
        1.8.4 Physical Layer
        1.8.5 Business Model and Mapping Layer
        1.8.6 Presentation Layer
1.9 The Expression Builder
1.10 Oracle BI Interface
1.11 Oracle BI Presentation Catalog
1.12 Oracle BI Components
        1.12.1 Analyses
        1.12.2 Subject Areas
        1.12.3 Views
        1.12.4 Dashboards
        1.12.5 Agents
        1.12.6 Alerts
        1.12.7 Conditions
        1.12.8 Actions
        1.12.9 Key Performance Indications (KPI)
        1.12.10 KPI Watchlist
        1.12.11 Scorecard and Strategy Management
        1.12.12 Oracle BI Publisher
1.13 Summary

Chapter 2 - Setup Oracle BI Environment

2.1 Case Study
2.2 Download Software
        2.2.1 Download Oracle Database 11g
        2.2.2 Download Oracle Business Intelligence & RCU
2.3 Install Oracle Database 11g
2.4 Launch Repository Creation Utility (RCU)
2.5 Install Oracle Business Intelligence
2.6 Test Installation
2.7 Create User
2.8 Summary

Chapter 3 - Create Dashboard

3.1 What a dashboard is?
3.2 Components and Features
        3.2.1 SQL Developer
        3.2.2 Oracle BI Server
        3.2.3 BI Administration Tool
        3.2.4 Oracle BI Repository
        3.2.5 Analyses
        3.2.6 Title View
        3.2.7 Table View
        3.2.8 Ticker View
        3.2.9 Graph View
        3.2.10 Gauge View
        3.2.11 Filters
        3.2.12 Dashboard
3.3 Problem Scenario – What are my future payments?
        3.3.1 Create Database User and Connection
        3.3.2 Create Database Tables
        3.3.3 Create Keys and Relationship
        3.3.4 Insert Data
        3.3.5 Create Physical Layer
        3.3.6 Create Business Model & Mapping Layer (BMM)
        3.3.7 Create Presentation Layer
        3.3.8 Load the Repository
        3.3.9 Create Analysis – Payment Maturities
3.4 Problem Scenario - What is the status of in-transit shipments?
        3.4.1 Create Database Tables
        3.4.2 Create Keys and Relationship
        3.4.3 Insert Data
        3.4.4 Update Physical Layer
        3.4.5 Update Business Model & Mapping Layer
        3.4.6 Update Presentation Layer
        3.4.7 Load the Repository
        3.4.8 Create Analysis – Shipment Tracking
3.5 Problem Scenario - What is the Product Category Volume?
        3.5.1 Create Database Tables
        3.5.2 Create Keys and Relationship
        3.5.3 Insert Data
        3.5.4 Incorporate new tables in the Physical Layer
        3.5.5 Move tables to the Business Model & Mapping Layer
        3.5.6 Add tables to the Presentation Layer
        3.5.7 Load the Repository
        3.5.8 Create Analysis – Product Category Volume
3.6 Problem Scenario – What is the Imports Volume?
        3.6.1 Create Analysis – Import Volume
3.7 Problem Scenario – What is the Product Volume?
        3.7.1 Add Data
        3.7.2 Modify the BMM Layer
        3.7.3 Modify the Presentation Layer
        3.7.4 Create Analysis – Product Volume
3.8 Create Dashboard’s Main Page
3.9 Add new dashboard page
        3.9.1 Create Analysis – Shipment Tracking Data
        3.9.2 Create Analysis – Product Category Volume Data
        3.9.3 Create Analysis – Import Volume Data
        3.9.4 Create Analysis – Product Volume Data
        3.9.5 Create a new dashboard page and add analyses
        3.9.6 Create Action Links
3.10 Summary

Chapter 4 - Business Analysis

4.1 About Analyzing Business
4.2 Problem Scenario – What is the business volume with different suppliers?
4.3 Components and Features
        4.3.1 Pivot Table View
        4.3.2 Duplicate Layer
        4.3.3 View Selector
        4.3.4 Conditions
        4.3.5 Report Links
        4.3.6 Preferences
4.4 Update Database
        4.4.1 Add a new column
        4.4.2 Create Keys and Relationship
        4.4.3 Insert Data
4.5 Update Physical Layer
4.6 Update Business Model and Mapping Layer
4.7 Update Presentation Layer
4.8 Load the Repository
4.9 Create Analyses
        4.9.1 Summarized Volume Analysis
        4.9.2 Detail Volume Analysis using Pivot Table
4.10 Add Analyses to a new dashboard page
        4.10.1 Create Condition
        4.10.2 Report Links
        4.10.3 Set Preferences
4.11 Summary

Chapter 5 - Delivering Contents

5.1 About Content Delivery
5.2 Problem Scenario – How to avoid demurrage?
5.3 Components and Features
        5.3.1 Agents
        5.3.2 Alerts
        5.3.3 Calculated Items
        5.3.4 Conditional Formatting
        5.3.5 Email Delivery
5.4 Required Analyses
5.5 Update Table Data
5.6 Recent Arrival Analysis
5.7 Create Agent
        5.7.1 Test the Agent
5.8 Incorporate Data
        5.8.1 Create Cost Table
        5.8.2 Create Keys and Relationship
5.9 Update and Load the Repository
5.10 Previous Arrival Analysis
5.11 Demurrage Paid Analysis
5.12 Send Alert through Email
        5.12.1 Configure SMTP Server
        5.12.2 Configure Email Account
        5.12.3 Add Email Delivery Channel to Agent
5.13 Summary

Chapter 6 - Performance Management

6.1 About Performance Management
6.2 Key Performance Indicators (KPI)
        6.2.1 KPI Editor
6.3 Problem Scenarios
        6.3.1 Shipment Clearance
        6.3.2 Duties Payment
        6.3.3 Product Unit Cost by Supplier
6.4 Update Database Table
6.5 Update Repository
6.6 Cost Comparison KPI – The Pinned Approach
6.7 Cost Comparison KPI – The Not Pinned Approach
6.8 Creating Scorecard
6.9 Shipment Clearance KPI
        6.9.1 Update Database Table
6.10 Duties Payment KPI
6.11 Visual result presentation using Strategy Tree
6.12 Summary

Chapter 7 - Publish Reports

7.1 Significance of Internal Reporting
7.2 Oracle BI Publisher
7.3 Problem Scenario
7.4 Oracle BI Publisher Interface
7.5 Establish Connectivity with Data Source
7.6 Create Data Model
7.7 Create Data Set
7.8 Get XML Output and Save Sample Data
7.9 Generate Report
7.10 Working with Layout Editor
7.11 Report Scheduling
7.12 Add Pivot Table
7.13 Create Template in MS Word
       7.13.1 Install BI Publisher Desktop
        7.13.2 Create Report Template
        7.13.3 Format Report
        7.13.4 Conditional Formatting
        7.13.5 Summary Calculation
        7.13.6 Add a Summary Chart
        7.13.7 Upload Template
        7.13.8 Create Pivot Table
7.14 Generate Purchase Order
        7.14.1 Update Database Tables
        7.14.2 Create Data Model
        7.14.3 Create Purchase Order Template
        7.14.4 Setup Schedule
7.15 Summary

Conclusion

About The Author

INDEX

Thursday 10 May 2012

Implement Oracle Business Intelligence (Volume 1)

Buy from Amazon

Book's Overview (This site is best viewed in Firefox)

The first volume of OBIEE implementation series, Implement Oracle Business Intelligence – Volume I, starts Business Intelligence exploration journey by refreshing concepts about data and information. Treading on its route towards practical implementation, the book presents concise but concrete definitions about a range of Oracle BIEE components. 

Besides concept presentation, the essence of this book is a practical scenario which initiates with the setup of BI environment and guides its audience in detail the use of various OBEEE tools to answer typical business questions put up by procurement department of an organization in an effort to implement organization’s strategy to reduce cost, evaluate processes, establish vigilance, and take informed timely decisions. 


The book’s theme can be summarized as under:

•    Business Intelligence and related concepts presentation
•    Acquaintance with and utilization of various Oracle BIEE tools and features
•    Practical Implementation in a department of a fictitious organization
•    Provide scattered information in one place to preserve audience time

Each chapter in the book focuses on some particular OBIEE components, provides key concepts about them and describes how they can be used to resolve business problems. For example, the Performance Management chapter is designed to present the following information:

Utilized BI component and related concepts
What is Scorecard?
What is Key Performance Indicator (KPI)?
Strategy Tree, a visual strategy presentation tool

Problem Scenario
What is the average unit price of a particular product, procured through multiple suppliers?
How much time is taken by a clearing agent to clear shipments (performance monitoring)?
How long does it take finance department to make duty payments (avoid demurrage cost)?

Hands On
Create KPIs to provide the required information.
Create strategies and objectives using Scorecard tool to monitor performance.
Create a strategy tree to visually present organization’s strategy and performance

Summary
Provides a summary of what the audience learned in the chapter.

This book deals with the issues of a particular department (procurement) and provides solutions to cope with them using Oracle BIEE. I’ve plans to write few more books like this one for other departments (Finance, Export etc.) to address their particular problems.

Intended Audience
Implement Oracle Business Intelligence (Volume 1) is intended for anyone willing to learn how to dig intelligence from the data mine using Oracle Business Intelligence Enterprise Edition. This book is beneficial for people responsible to organize and present data for making critical and timely business decisions such as top management, managers, business analysts, programmers, report specialist and information consumers. It follows a case study of Import (procurement) department in a fictitious organization where several key issues of this department are resolved proactively using this robust Oracle technology. The book is designed in such a manner that it first presents the components and features of OBIEE, then the problem scenario faced by the department, and finally the hands-on exercises to resolve the issues using the described components and features.

Case Study
There is nothing more than a good hands-on book to evaluate a technology. This book, Implement Oracle Business Intelligence (Volume 1), follows an intuitive approach and provides unique practical examples to explore Oracle BIEE. In this book, I've specifically focused on problems faced by Imports (procurement) department of an organization. But, the techniques applied here are generic and can be utilized for other situations as well. Let's take a look at the case study presented in this book.

The Import department of ABC Corporation is using an Imports Management and Information Software, The Import Manager, to manage its imports proceedings. The software produces several key reports to provide insight into the imports process, but
individually. The Imports department head, Mr. Frank, wants to see all the information at a glance. In addition, he needs some specific reports and vigilant information that the existing software cannot deliver proactively. He discussed the problem with the IT head and put-up the following questions:

1. What are my future payments due to banks?
2. What is the status of in-transit shipments?
3. What is the import volume of each category?
4. What is the comparative imports volume?
5. What is the import volume of individual products?

In reply to the above queries, the IT department suggested a dashboard that would display all the information on a single screen.

ABC Corporation is using Oracle 11g database on the back-end. So, the development team has decided to take advantage of the most robust tool, Oracle Business Intelligence, to prepare a professional looking dashboard for Mr. Frank. The team initiates the project by conducting an analysis on the existing application and corresponding database objects.

Besides the above five questions (answered graphically on the main dashboard page), there are many more discussed in this book to answer business questions of Imports department and to evaluate performance of internal departments and external business partners.See Table of Content


Note: This book is available in color and b/w formats on Amazon.

Next


Wednesday 9 May 2012

Chapter 1

Introduction to Oracle Business Intelligence (excerpts from the book)


The first volume of Implement Oracle Business Intelligence series, takes you off by introducing the world of business intelligence. This chapter discusses the following basic information before the practical hands-on implementation of OBIEE:

  • Data and Information
  • SQL and its Limitation
  • What is Business Intelligence?
  • Why Use Business Intelligence?
  • What are the Benefits?
  • Oracle Business Intelligence
  • Oracle BI Repository and BI Server
  • Measures, Dimensions and BI Repository Layers
  • Logical Fact Tables
  • Logical Dimension Tables
  • Identifying Dimensions
  • Physical Layer
  • Business Model and Mapping Layer
  • Presentation Layer
  • The Expression Builder
  • Oracle BI Interface
  • Oracle BI Presentation Catalog
  • Oracle BI Components
  • Analyses in OBIEE
  • What are Subject Areas?
  • Views used in Oracle Business Intelligence
  • Dashboards in OBIEE
  • Agents concept in Oracle Business Intelligence
  • Alerts
  • Conditions
  • Actions
  • Key Performance Indications (KPI)
  • KPI Watchlist
  • Scorecard and Strategy Management
  • Oracle BI Publisher

Data and Information

The words data and information are very frequently used in our daily lives and are often used interchangeably. However, there are many differences between the meanings and use of these two words.

Data are facts that people collect through their observations and experiences while information are interpreted facts based on the gathered data. Data refers to the lowest abstract or a raw input which when processed or arranged generates information. Information is obtained through analysis, communication, or investigation. As an example, if you have a list on the top ten travel sites, that is data; if you have a book
giving details about each site, it is information.

Any kind of understanding or knowledge that can be exchanged with people is information. It can be about facts, things, concepts, or anything relevant to the topic concerned.

Data can be in the form of numbers, characters, symbols, or even pictures. When it exists in this raw form, the data has no significance. It gains importance when it is arranged into something meaningful. A collection of these data which conveys some meaningful idea is information. It may provide answers to questions like who, which, when, why, what, and how.

SQL Limitations

Structured Query Language (SQL), is a specialized language for managing data in relational database management systems (RDBMS).

You can use simple SQL queries to extract information from the data source. In complicated situations where data is stored in different sources and in different formats, you need to issue complex analytical SQL queries to extort the information.

This primary tool has been the main source for extracting information from data for decades. But when it comes to answer business analysis questions, SQL comes up with the following drawbacks:

  • Writing SQL statements is too hard to review business processes
  • It is not designed to access unstructured or semi‐structured data.

Business Intelligence tools emerged on the market due to the above mentioned SQL limitations. These tools enable better decision‐making by simplifying the process of business analysis and data publishing stored in any source and in any format. There is further practical explanation in the book to demonstrate the drawbacks of using SQL mentioned above.

What is Business Intelligence?

Business intelligence can simply be defined as transformation of data into information and then into intelligence. It provides you the power to get significant data in time, and in an efficient manner. The main objective of business intelligence is to allow you to make high quality decisions to achieve more opportunities. Many factors, such as internal business processes, economic environment, customers, business partners and competitors help in making such decisions. These major assessments, not only
directs a company towards the success milestone but also helps a lot in improving its performance. It is business intelligence that will provide you a competitive edge over your competitors and will allow you get an insight into your company’s processes to evaluate whether it needs improvements. This topic further explains why businesses use BI tools and what are the common business intelligence functions.

Why use Business Intelligence?

This topic provides a list of factors that form the basis to use business intelligence such as, verifying the organization’s health by checking its strength and weaknesses.

What are the benefits of using Business Intelligence?

  • Get instant information through high performance queries
  • Obtain interactive analysis over large volumes of data
  • Drill down on your information
  • Fetch information from multiple data sources
  • No need to be a reporting guru
  • No impact on the performance of live applications

What is Oracle Business Intelligence?

Oracle Business Intelligence is a comprehensive set of enterprise business intelligence tools and infrastructure, including a scalable and efficient query and analysis server, an ad‐hoc query and analysis tool, interactive dashboards, proactive intelligence and alerts, real‐time predictive intelligence, and an enterprise reporting engine. Oracle Business Intelligence is designed to bring greater business visibility and insight to a wide variety of users. It provides a full range of business intelligence capabilities that allow you to:
  • Collect up‐to‐date data from your organization
  • Present the data in easy‐to‐understand formats (such as tables and graphs)
  • Deliver data in a timely fashion to the employees in your organization
These capabilities enable your organization to make better decisions, take informed actions, and implement more‐efficient business processes.

Oracle BI Repository and Oracle BI Server

After installation of required software (chapter 2 explains how to download and install Oracle Database, Oracle Business Intelligence, and RCU-Repository Creation Utility), the initial step is to plan and design your metadata repository. This process includes working with the physical contents, planning your business model, and preparing the presentation layer for end users. You will use BI Administration Tool to create and edit your Oracle BI repository.

The Oracle BI Server is an Oracle Business Intelligence component that processes user requests and queries underlying data sources. Combined together, the architecture of the Oracle BI repository and the Oracle BI Server provides a layer that enables users send simple Logical SQL queries against complex data sources.

The topic elaborates what the Oracle BI Server maintains, types of data sources it can connect, how it connects to the underlying data sources, and how it uses the metadata in the Oracle BI repository.

Measures, Dimensions, and Oracle BI Repository Layers

There are three layers in an Oracle BI repository; Physical, Business Model and Mapping, and Presentation. You must first prepare a high‐level design of your Business Model that exposes the analytic requirements of your end users. To determine what content to include in your business model, you must first identify the logical columns on which users need to query. Then, to establish the role played by each column, identify whether it is a measure column or a dimensional attribute.

You're provided in-depth details about Logical Fact Tables, Logical Dimension Tables, Identifying Dimensions, Physical Layer, Business Model & Mapping Layer, and Presentation Layer.

The Expression Builder

Expression Builder is used in the Administration Tool to create constraints, aggregations, and other definitions within a repository. These expressions are similar to expressions created with SQL. Using Expression Builder interface, you perform some operations and functions on your back-end data. For instance, create a derived character type column from an existing numeric column using the Cast conversion function. Here, you'll acquaint yourself with different sections of the Expression Builder.


PreviousHome